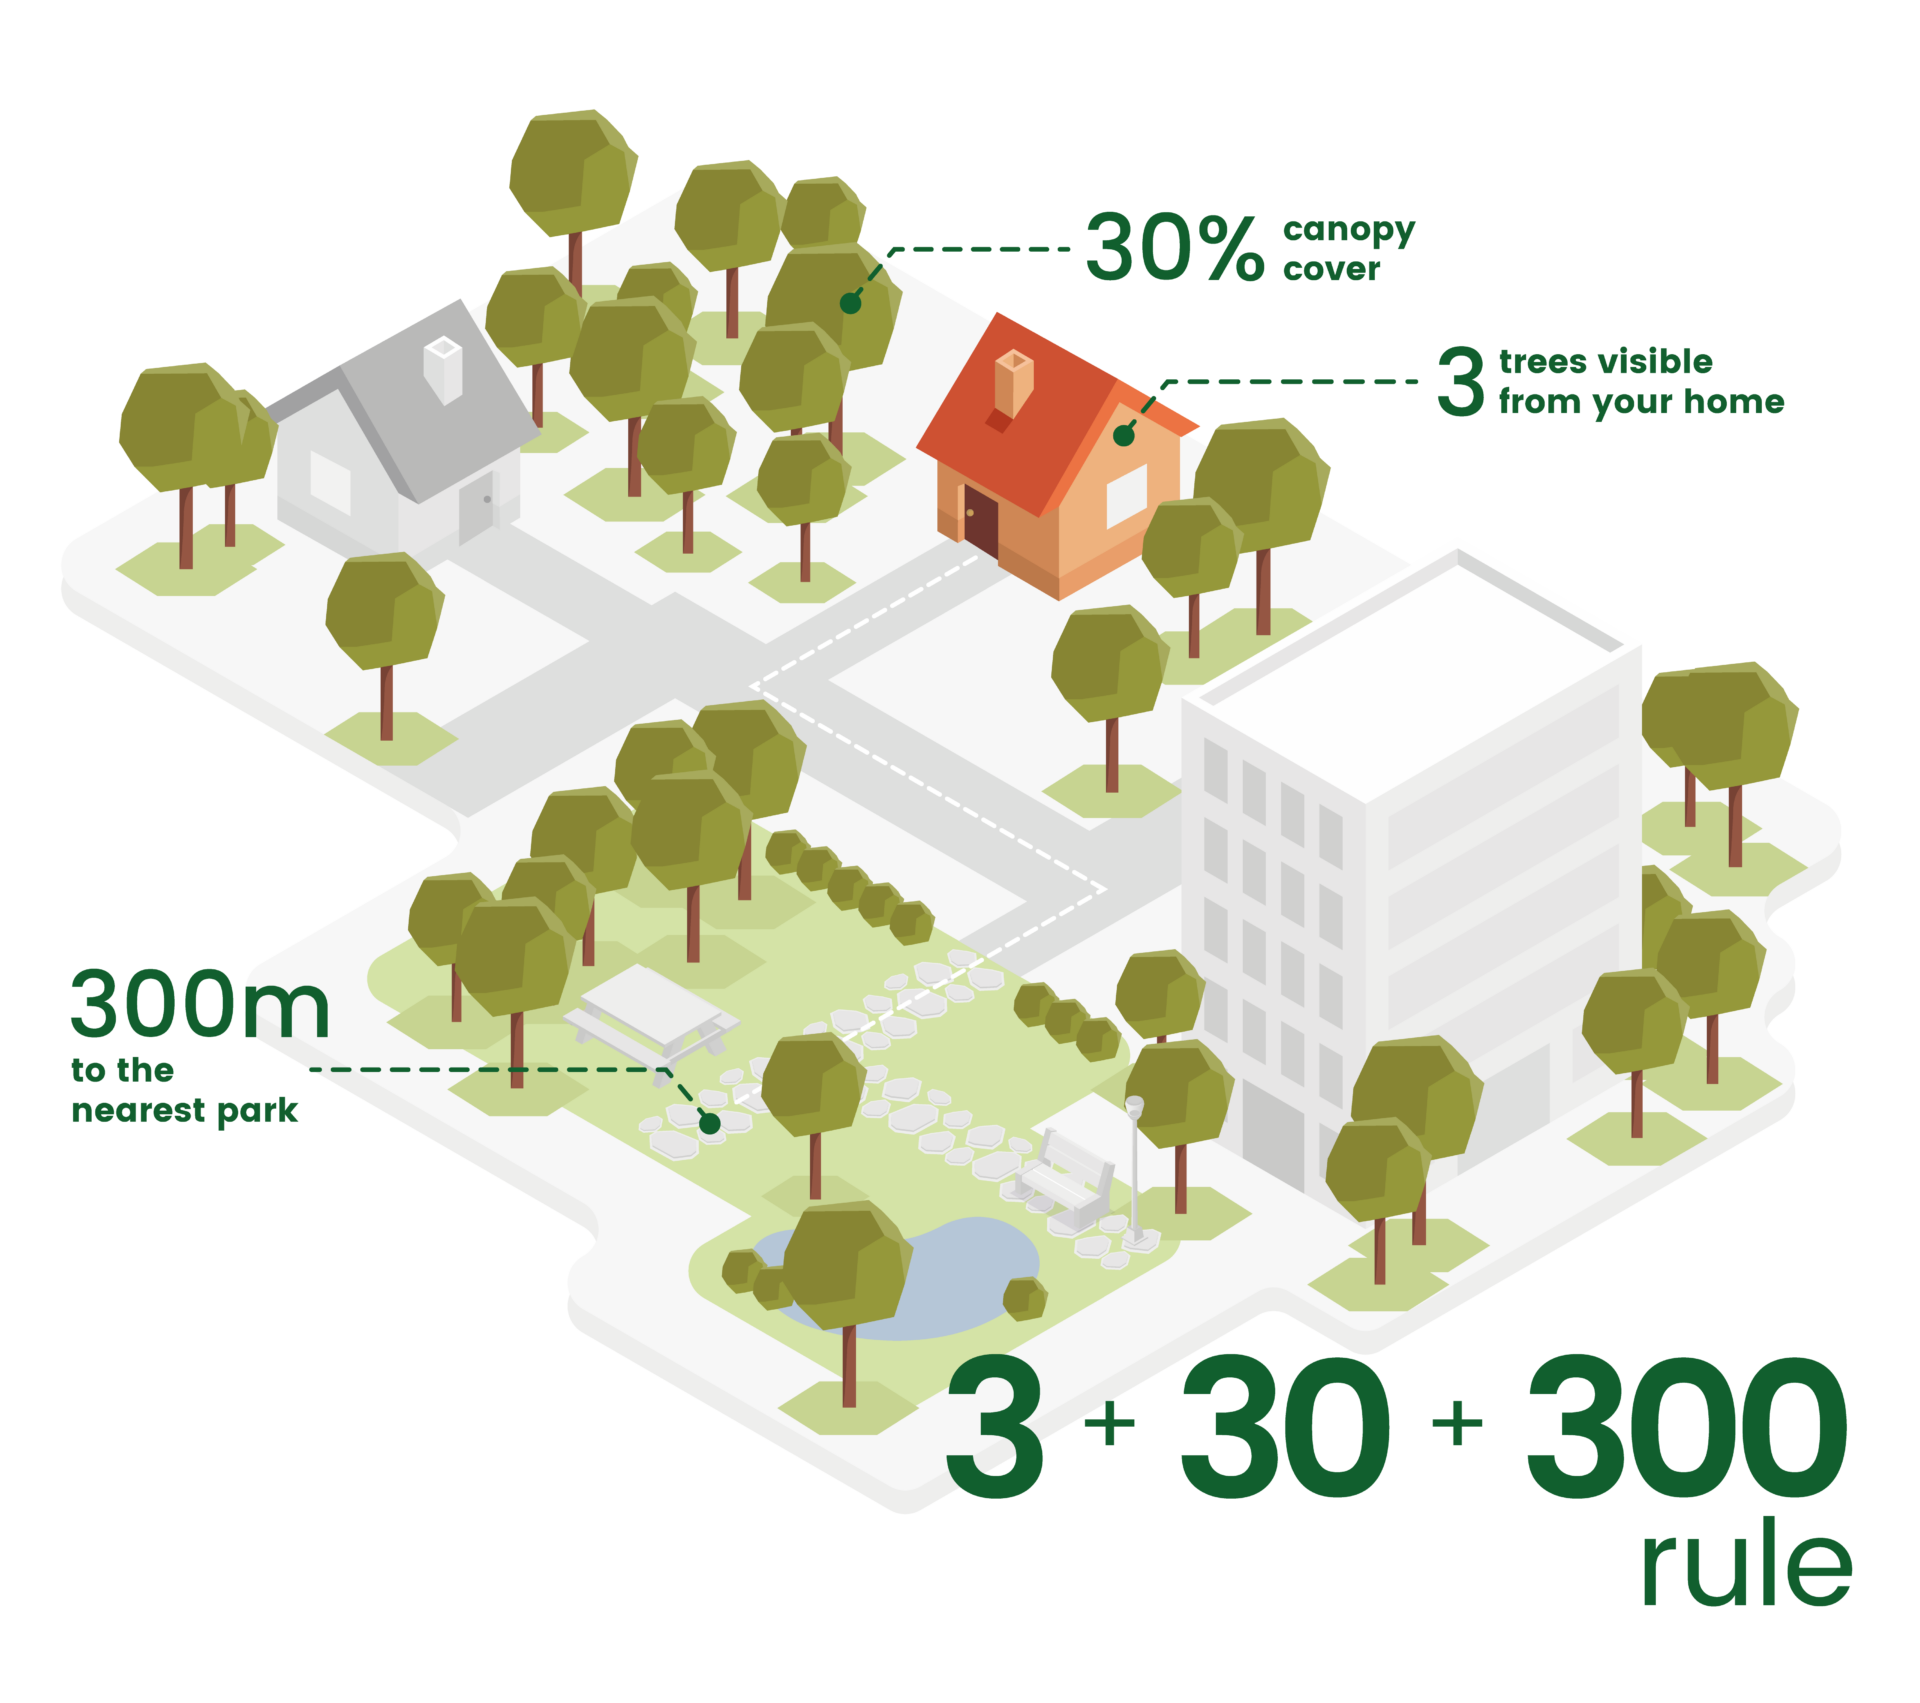
The 3+30+300 Rule, developed by Dutch professor Dr. Cecil Konijnendijk, is the global standard for urban greening. This rule helps cities plan for better health, climate adaptation, and biodiversity. By understanding how neighborhoods and buildings score, cities can set priorities and green effectively. These scores also spark discussions with policymakers, residents, and businesses about where greening is most needed.
How green is Australia?
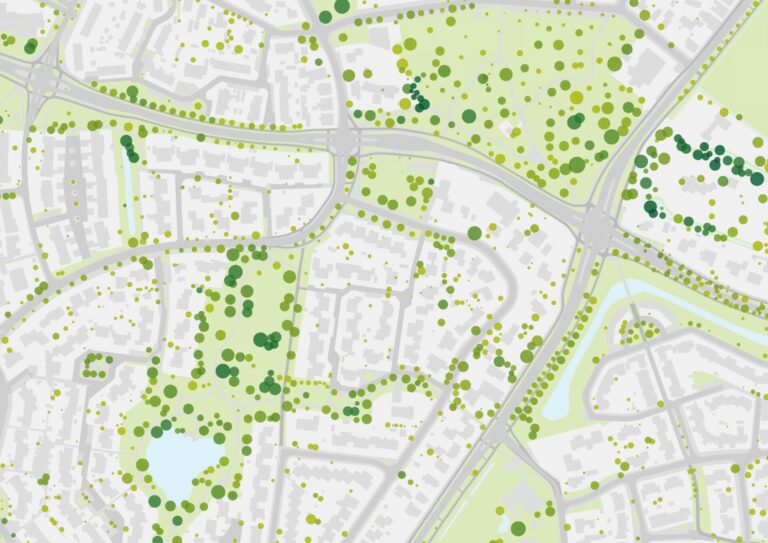
Can you see three trees from your window? Does your neighborhood have 30% tree canopy cover? Are you within 300 meters of a green space? We have conducted the analysis for every property in Australia. We have data for the entire country but also offer specific cities.
Our analysis provides the data-driven insights needed to make cities greener, healthier, and more climate-resilient.
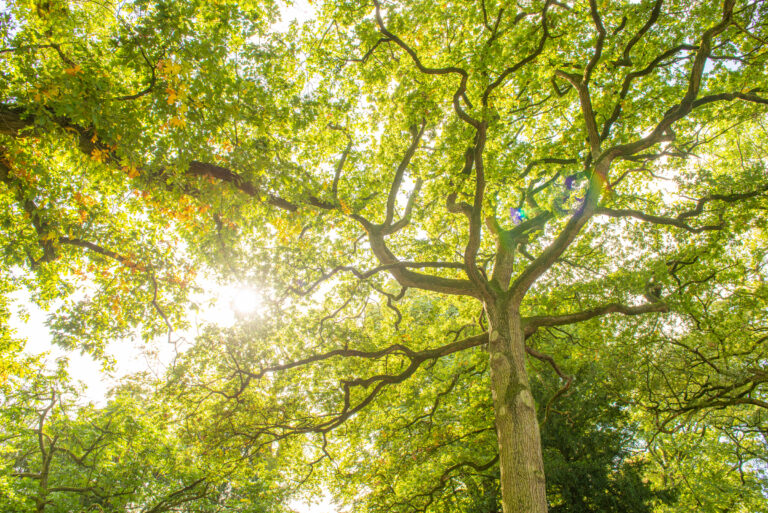
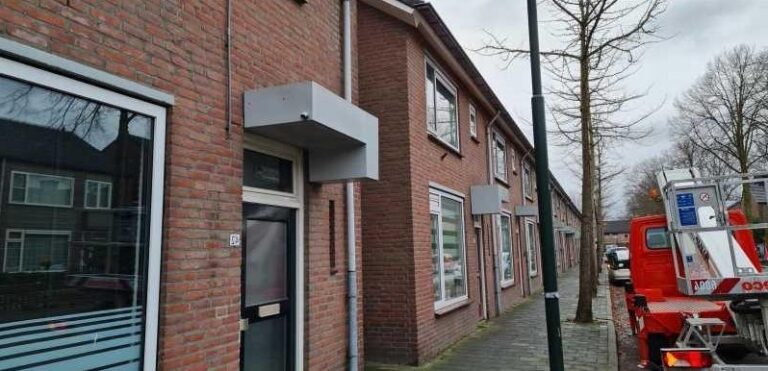
Everyone should be able to see at least three large trees from their home, workplace, or school. Our data pinpoints where this is already achieved and where the biggest opportunities lie.
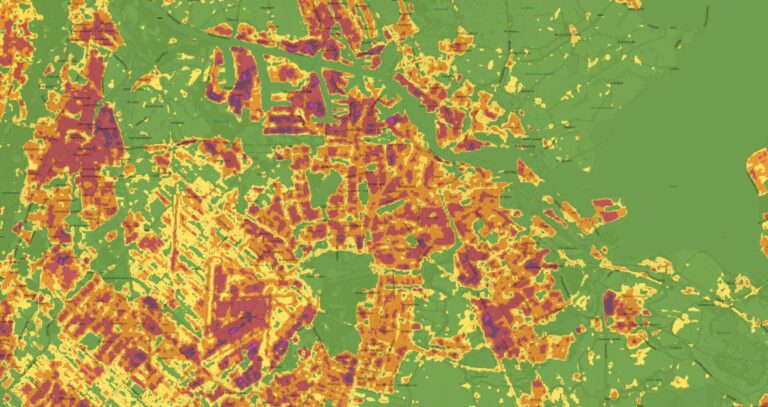
A healthy, climate-resilient city should have at least 30% tree canopy cover per neighborhood. We calculate the tree canopy cover for each home and aggregate the results to highlight areas for improvement.
No one should live more than 300 meters from a publicly accessible, high-quality green space. We identify which cities meet this benchmark and where urgent greening efforts are needed
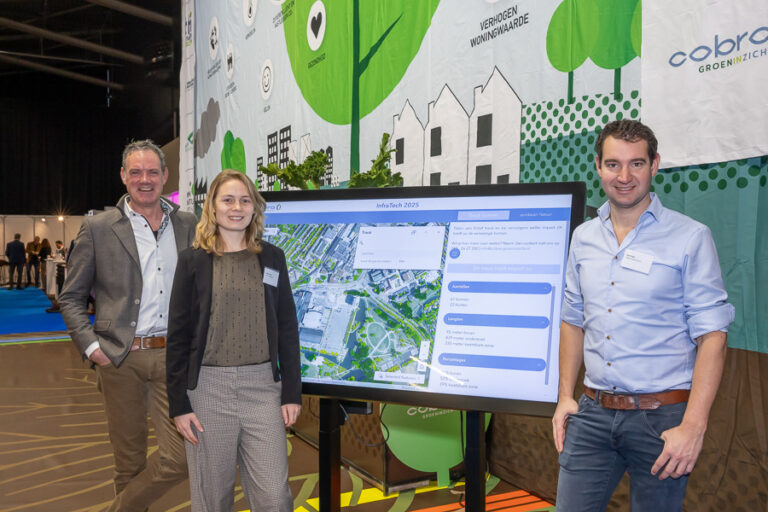
Check out the viewer to see how your municipality scores on the 3+30+300 rule. In this free version, you can see the total score per municipality or district. As an example, Melbourne and Sydney are available to explore in the viewer.
Cobra is een adviesbureau van aanpakkers en doorzetters. Wij werken door heel Nederland voor gemeenten, provincies, waterschappen, bedrijven, ontwikkelaars en non-profit organisaties.
Onze visie is om wereldleider te zijn in het in kaart brengen van stedelijke natuur en het geven van inzicht in de toekomstige leefomgeving.

We offer a data-package for municipalities. The GIS – dataset includes the data per building on the 3, the 30 and the 300. And also the totalscore per building.
Optional we can deliver three PDF maps per score and a PDF map of the total score. After placing your order, we will contact you first.
Is your municipality larger than 300.000 inhabitants? Please contact us here.

Lorem ipsum dolor sit amet, consectetur adipiscing elit. Ut elit tellus, luctus nec ullamcorper mattis, pulvinar dapibus leo.
Lorem ipsum dolor sit amet, consectetur adipiscing elit. Ut elit tellus, luctus nec ullamcorper mattis, pulvinar dapibus leo.
Lorem ipsum dolor sit amet, consectetur adipiscing elit. Ut elit tellus, luctus nec ullamcorper mattis, pulvinar dapibus leo.
Lorem ipsum dolor sit amet, consectetur adipiscing elit. Ut elit tellus, luctus nec ullamcorper mattis, pulvinar dapibus leo.
Lorem ipsum dolor sit amet, consectetur adipiscing elit. Ut elit tellus, luctus nec ullamcorper mattis, pulvinar dapibus leo.
Lorem ipsum dolor sit amet, consectetur adipiscing elit. Ut elit tellus, luctus nec ullamcorper mattis, pulvinar dapibus leo.
Lorem ipsum dolor sit amet, consectetur adipiscing elit. Ut elit tellus, luctus nec ullamcorper mattis, pulvinar dapibus leo.
Lorem ipsum dolor sit amet, consectetur adipiscing elit. Ut elit tellus, luctus nec ullamcorper mattis, pulvinar dapibus leo.



Om de beste ervaringen te bieden, gebruiken we technologieën zoals cookies om apparaatinformatie op te slaan en/of te raadplegen. Door toestemming te geven voor deze technologieën kunnen we gegevens verwerken, zoals browsegedrag of unieke ID's op deze site. Als u geen toestemming geeft of uw toestemming intrekt, kan dit bepaalde functies en mogelijkheden negatief beïnvloeden.

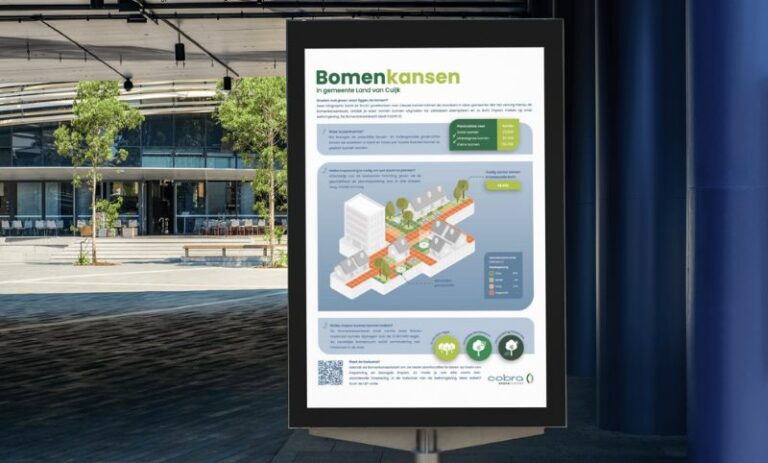
Wat is de boomkroonbedekking in mijn gebied (gemeente, wijk, buurt, grid)
Hoe was de boomkroonbedekking in het verleden?
Welk reëel ambitieniveau is voor de toekomst haalbaar?
Hoe ver zit ik van mijn doelstelling af?